Step 6: Select Bridges
TOOLS
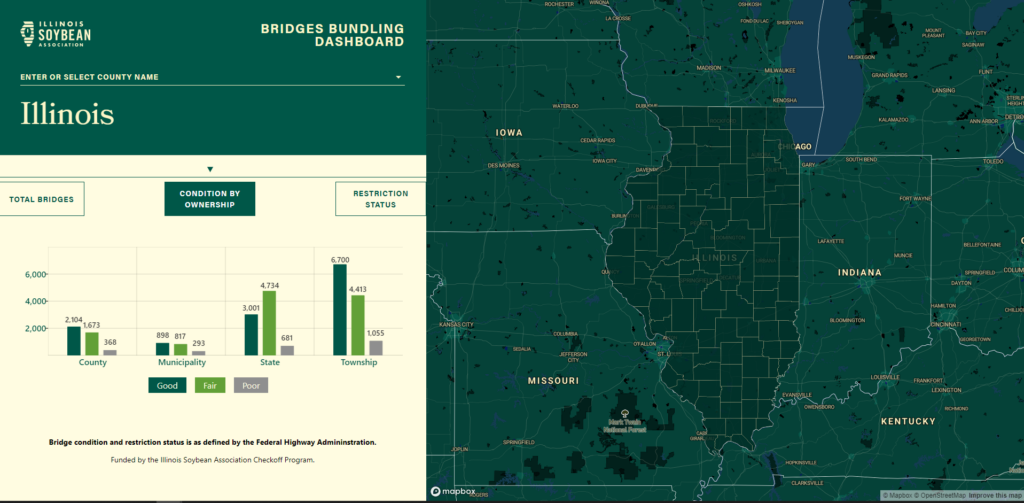
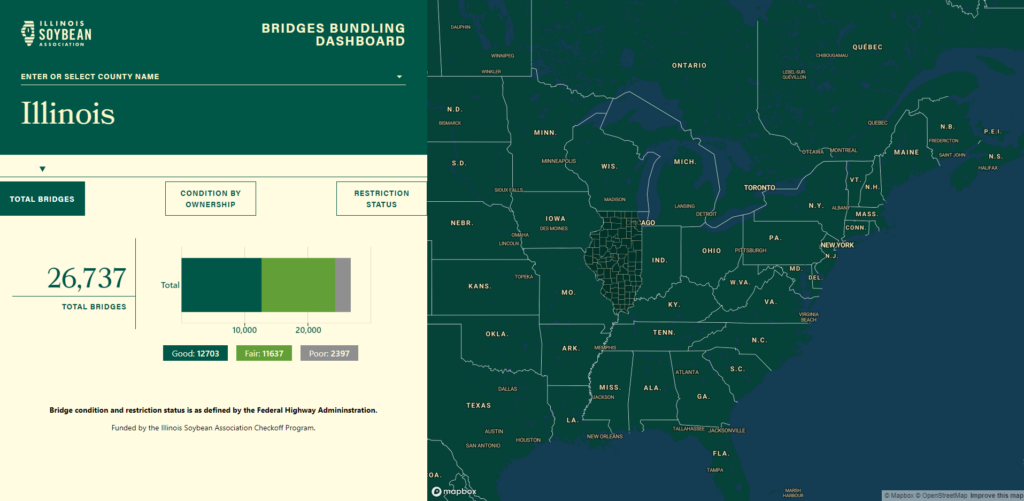
The Illinois Soybean Association has developed a tool that can aid in the identification of specific bridges to be included in a Bridge Bundling program. The Bridges Bundling Dashboard provides a holistic overview of Illinois’ bridges, providing the number of bridges in each county, as well as the FHWA condition of each bridge (“Good”, “Fair”, and “Poor”). The information about bridge condition contained in this tool would be a logical starting point to identify the bridges in a certain county or counties that may be included in a Bridge Bundling project.
Using the bridges deemed “Poor” as a starting point to develop a shortlist of bridges, the project sponsor can then select specific bridges for inclusion in the project. The exact criteria that will be used may include:
- Geographic location and proximity
- Road type, geometry, traffic, and work zone control
- Bridge size
- Similar bridge types
- Similar work types
- Environmental permitting
- Hydrology and hydraulics
- Geotechnical conditions
- Utilities/Third parties
- Right-of-Way
- Railroads
BRIDGES BUNDLING DASHBOARD


Bridge Selection Matrix
| AGENCY | FUNDING SOURCE | D-B-B | IDIQ | CM/GC | D-B | P3 |
| Delaware DOT | Federal – State | 2-20 | 22 | – | 28 | – |
| Erie County, NY | Federal – Local | 3-25 | – | – | – | – |
| Georgia DOT | State | – | – | – | 5-7 | – |
| Northampton County, PA | Private – Local | – | – | – | – | 33 |
| Ohio DOT | GARVEE Bonds | 2-3 | – | – | 2-6 | – |
| Oregon DOT | State | – | – | 3 | – | – |
| Osceola County, FL | Local | – | – | 13 | – | – |
| South Carolina DOT | Federal – State | 3-5 | – | – | 3-13 | |
| RANGE | – | 2-25 | 22 | 3-13 | 2-28 | 33 |
Table of Contract Durations
| AGENCY | D-B-B | IDIQ | CM/GC | D-B | P3 |
| Delaware DOT | – | 3-5 | – | – | – |
| Erie County, NY | 2 | – | – | – | – |
| Georgia DOT | – | – | – | 3 | – |
| Missouri DOT | 3 | – | – | 5 | – |
| Nebraska DOT | 1-2 | – | – | – | – |
| New York State DOT | 1-2 | 1-3 | – | 2 | – |
| Northampton County, PA | – | – | – | – | 12+10 |
| Ohio DOT | – | – | – | 3 | – |
| Oregon DOT | – | – | 7 | – | – |
| Osceola County, FL | – | – | 7 | – | – |
| Pennsylvania DOT | 2 | – | – | – | 25 |
| South Carolina DOT | – | – | – | Varies | – |
| RANGE | 1-3 | 1-5 | 7 | 2-5 |